Smith River Complex
Includes the Diamond, Kelly, and Prescott Fires along with other smaller fires
Page Last Updated: September 5, 2023
Information per InciWeb
Start Date: August 15, 2023
Initial Location: Six Rivers National Forest
Initial Latitude/Longitude: 41.945944, -123.891722
Latitude / Longitude Used: 41.945944, -123.891722
10 Miles Radius Zip Codes: 95543
10 Miles Radius Towns/Cities: Gasquet
20 Miles Radius Zip Codes: 95543,97534,95567,95531,95538,97523
20 Miles Radius Towns/Cities: Gasquet, O Brien, Smith River, Crescent City, Fort Dick, Cave Junction
50 Miles RadiusZip Codes: 95543,97534,95567,95531,95538,97523,95532,97531,97415,95548,96039,97538,97544,97543,96086,95568,97533,95555,97527,97491,97444,97528,97532,97406,97530,97526,96085,97464,96050,95556
Zip Code & Town/City information pulled from FreeMapTools – Find ZIP Codes Inside a Radius
Mile radius size reference points: 5 mile radius covers about 78 sq miles, 10 mile radius covers about 314 sq miles, 15 mile radius covers about 707 sq miles, 20 mile radius covers about 1,257 sq miles, 25 mile radius covers about 1,963 sq miles, 30 mile radius covers about 2,827 sq miles, and 50 mile radius covers about 7,854 sq miles.
Acreage size reference points: 1 football field = about 1.3 acres; 640 acres = 1 sq mile;
12,800 acres = 20 sq miles; 32,000 acres = 50 sq miles; 96,000 acres = 150 sq miles; 320,000 acres = 500 sq miles; 480,000 acres = 750 sq mile.
Note about size reference points – fires rarely burn in nice even circles, therefore these reference points are general guides and the shape of the fire perimeter must be taken into account (e.g. a fire burn area may be significantly less than the 1,257 sq miles covered by a 20 mile radius yet extend beyond the 20 mile radius because the burn area is long but narrow).
Resource Links
Fire Information
Northern California Geographic Coordination Center News & Notes
MODIS & VIIRS Satellite Fire Activity Map
red dots = last 12 hours, orange dots = 12-24 hours, yellow dots = last 24-48 hours
NASA FIRMS Satellite Fire Activity Map (downloadable NASA FIRMS – KMZ and Shapefiles)
ALERTCalifornia Wildfire Webcams
Additional County Information Links are towards the bottom with the social media feeds
Evacuation & Shelter Information
Demographics
Average Number of Persons per Household:
Del Norte County: 2.62 State average: 2.92
Del Norte County Percent of Persons:
Under 5 Years: 4.9% Under 18 Years: 20.9% Over 65 Years: 20.5%
Owner-occupied housing unit rate:
Siskiyou County: 68.3% State average: 55.5%
Data from US Census Bureau
Note – unless otherwise noted, these are county demographics and local conditions may differ some.
Infrastructure Links
Jump to Section: Resource Links Air Quality Weather Fuel Conditions County Links & Social Media Feeds
Power & Natural Gas
Poweroutage.us Del Norte County Outage List – This site provides aggregates live power outage data, though may not include some of the smaller local utilities.
Communications
Roads
Caltrans Check Current Highway Conditions
Caltrans District 1 Updates – covers the counties of Del Norte, Humboldt, Lake, and Mendocino (feed also viewable in social media section below)
Caltrans Truck Network Map for District 1
Aviation
FAA No Fly Zones – provides a list of no fly / restricted flight areas
Flight Radar 24 – here you can see flight paths of aviation fire fighting resources including both planes and helicopters.
Mail & Freight Shipping
Air Quality & Smoke Links
Weather
Wind Map
Temperature Map
National Weather Service Watches, Warnings, and Advisories
Warning – A warning is issued when a hazardous weather or hydrologic event is occurring, is imminent, or has a very high probability of occurring. A warning is used for conditions posing a threat to life or property.
Advisory – Highlights special weather conditions that are less serious than a warning. They are for events that may cause significant inconvenience, and if caution is not exercised, it could lead to situations that may threaten life and/or property.
Watch – A watch is used when the risk of a hazardous weather or hydrologic event has increased significantly, but its occurrence, location, and/or timing is still uncertain. It is intended to provide enough lead time so that those who need to set their plans in motion can do so.
These definitions are from the National Weather Service Glossary.
 NOAA NWS Watches, Warnings, and Advisories for
- An error has occurred, which probably means the feed is down. Try again later.
Regional Fuel Conditions
Burning Index
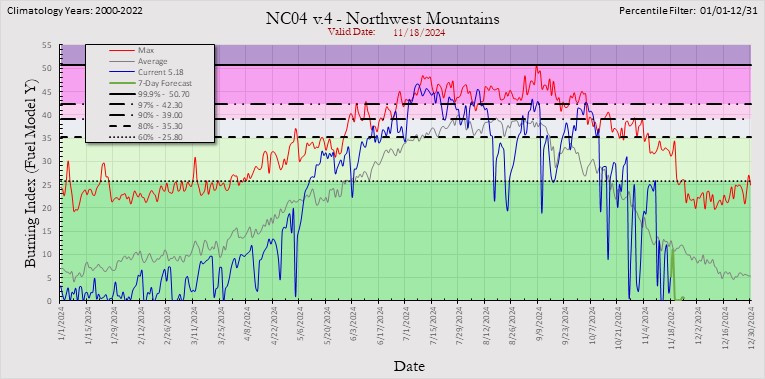
Burning Index is a measure of fire intensity. It combines the Spread Component (a rating of the forward rate of spread of a head fire) and Energy Release Component (estimated potential available energy released per unit area in the flaming zone of a fire) to relate to the contribution of fire behavior to the effort of containing a fire.
100-Hour Fuel Moisture
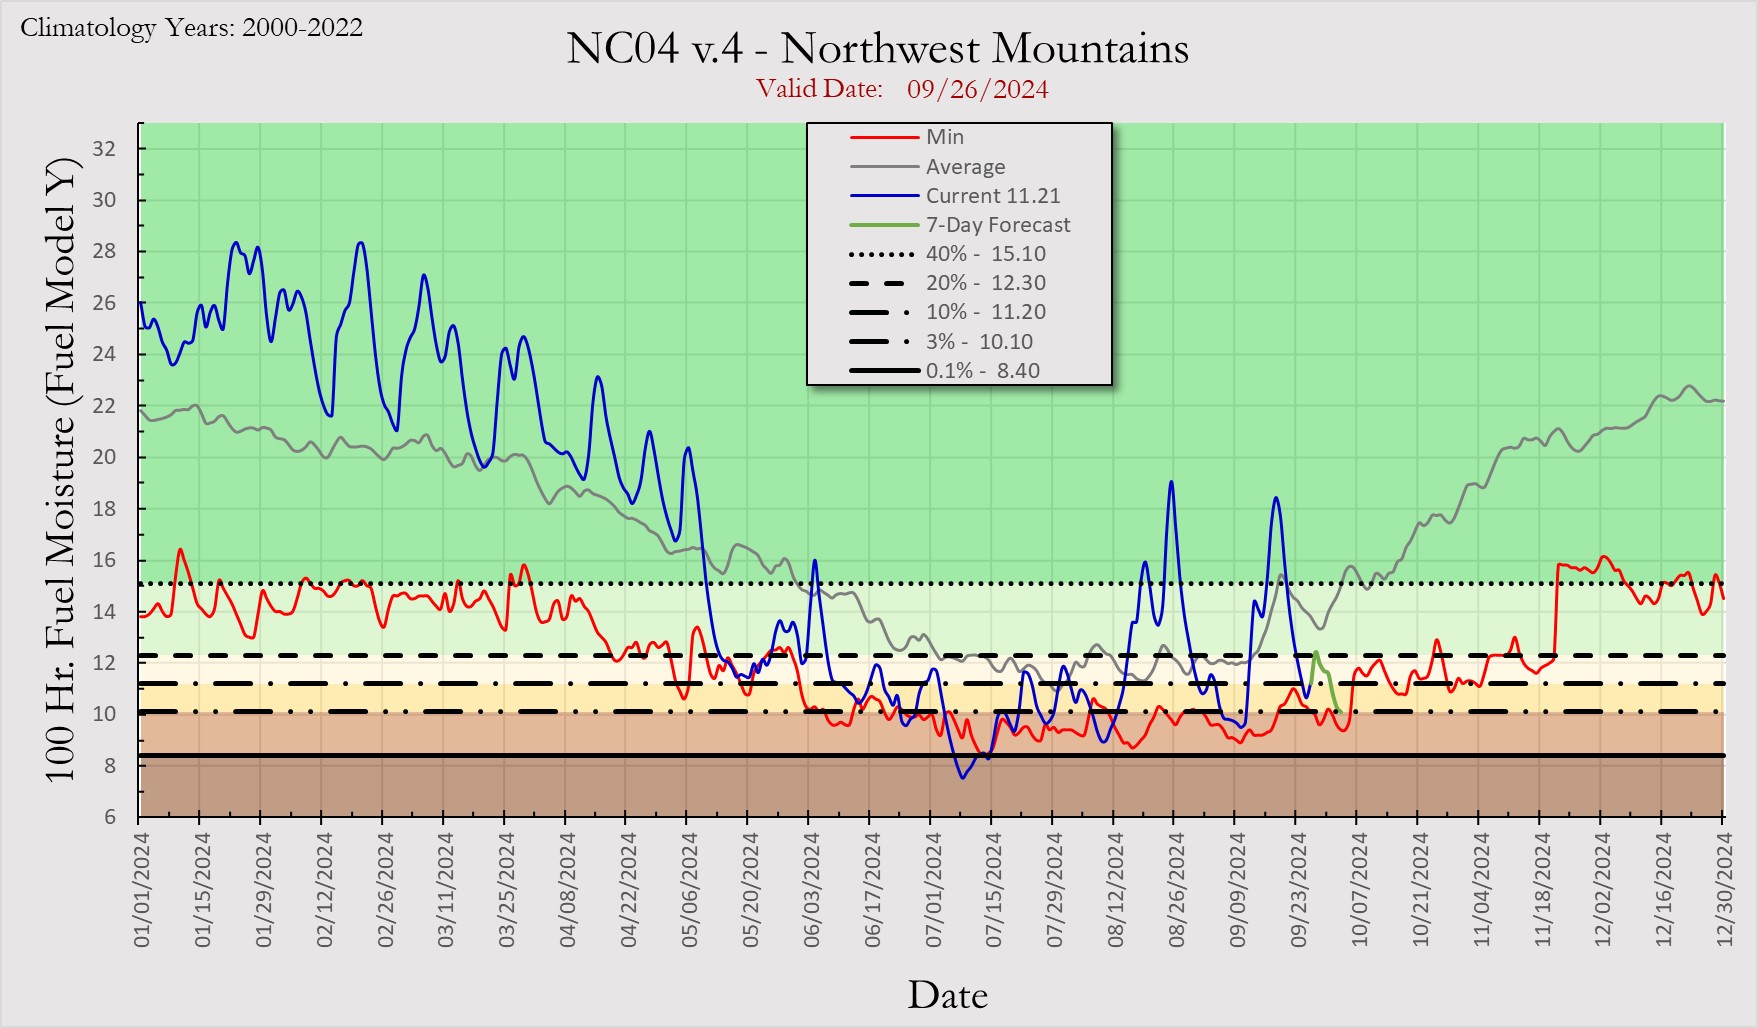
100-Hour Fuel Moisture is computed from 24–hour average conditions composed of day length, hours of rain, and daily temperature/humidity ranges. It can also be used as a very rough estimate of the average moisture content of the forest floor from three-fourths inch to four inches below the surface.
County Links & Social Media Feeds
Jump to Section: Resource Links Infrastructure Links Air Quality Weather Fuel Conditions

