Post Fire Incident Resource Page
Page/Links Last Updated: June 16, 2024
This page provides a collection of links to informational resources related to this fire and various infrastructures.
Information per CAL FIRE
Start Date: June 15, 2024
Initial Location: Gorman Rd, Gorman, CA
Initial Latitude/Longitude: 34.79208,-118.8521
Wildfires rarely burn in nice even circles, therefore these reference points are general guides and the shape of the fire perimeter must be taken into account (e.g. a fire burn area may be significantly less than the 1,257 sq miles covered by a 20 mile radius yet extend beyond the 20 mile radius because the burn area is long but narrow). Smoke from the wildfire may also cover a larger geographic area.
Acreage size reference points: 1 football field = about 1.3 acres; 640 acres = 1 sq mile;
12,800 acres = 20 sq miles; 32,000 acres = 50 sq miles; 96,000 acres = 150 sq miles; 320,000 acres = 500 sq miles; 480,000 acres = 750 sq mile.
Mile radius size reference points: 5 mile radius covers about 78 sq miles, 10 mile radius covers about 314 sq miles, 15 mile radius covers about 707 sq miles, 20 mile radius covers about 1,257 sq miles, 25 mile radius covers about 1,963 sq miles, 30 mile radius covers about 2,827 sq miles, and 50 mile radius covers about 7,854 sq miles.
Latitude / Longitude Used: 34.79208,-118.8521
10 Miles Radius Zip Codes: 93243
10 Miles Radius Towns/Cities: Lebec
20 Miles Radius Zip Codes: 93243,93225,93532
20 Miles Radius Towns/Cities: Lebec, Frazier Park, Lake Hughes
50 Miles RadiusZip Codes: 93243,93225,93532,93536,93222,91384,93203,93560,93040,93015,91310,93016,93313,91383,91354,91355,93023,91380,91390,93252,93060,91381,91350,93241,93561,93061,93024,93581,91351,91322,93021,91382,91386,93531,93065,93020,93311,93066,91387,93063,93099,93062,93094,93022,91321,93551,91311,93307,93220,93304,91326,93064,93004,91344,91313,93276,91360,93534,93309,91392,93003,93010,91304,91394,93011,93539,93584,93586,91362,93302,93303,93380,93383,93384,93385,93386,93387,93388,93389,91307,93009,93012,91342,93390,91324,93268,91377,93305,93036,91319,91330,91340,93301,91345,91341,93502,91327,91328,91358,91359,91346,91395,91325,91306,91396,91305,91308,91309,93002,93005,93006,93007,93599,91303,93501,91343,93306,91333,93312,93510,93590,91361,93030,91331,91335,91385,91337,91367,91371,93031,93032,93034,91301,91402,91365,91412,91320,91372,93013,91406,91357,91364,91376,91040,93014,91405,93041,93033,93518,91356,93043,91316,93035,93314,91302,91404,91407,91408,91409,91410,91470,91482,91499,91411,91041,91605,91416,91426,91353,91352,91436,93044,91401,91043,91606,93067,93108,91403,93552,91042,91413
Zip Code & Town/City information pulled from FreeMapTools – Find ZIP Codes Inside a Radius Another version of the tool allows you to get zip codes within a user defined polygon.
Resource Links
Fire Information
CAL FIRE Incident Page: This page is CAL FIRE’s incident page for this wildfire. The amount of details provided vary depending on CAL FIRE’s level on involvement in the fire response.
InciWeb Incident Page: This page is a federal interagency page managed by the US Forest Service providing information on this wildfire.
Esri Wildfire Aware Living Atlas: The Wildfire Aware app is intended to provide information about the current status and potential impact of wildfire incidents, including information on local demographics. The data included in this application can all be found in ArcGIS Living Atlas and are from authoritative entities.
Southern California Geographic Coordination Center News & Notes: The page provides morning/evening and occasionally mid-day snapshot updates on all wildfires in the Southern and Central California involving some level of federal fire fighting response.
Satellite Fire Activity Map: This map from the National Interagency Fire Center shows fire perimeter and recent satellite detected thermal activity (red dots = last 12 hours, orange dots = 12-24 hours, yellow dots = last 24-48 hours). Clicking on a thermal activity spot will provide more precise data in regards to time. From the layer menu on the left side bar additional layers can be added.
NASA FIRMS Satellite Fire Activity Map: Thermal activity detected by the MODIS sensors on the NASA Aqua and Terra satellites. Near real-time fire data are available within approximately 3 hours of satellite overpass and imagery within 4-5 hours. Satellites take a ‘snapshot’ of events as they pass over Earth. Each hotspot/active fire detection represents the center of a pixel flagged as containing one or more fires or other thermal anomalies. For MODIS the pixel is approximately 1 km and for VIIRS the pixel is approximately 375 m. Downloadable NASA FIRMS – KMZ and Shapefiles are also available. NASA FIRMS tutorial for the basic and advanced features of the tool.
ALERTCalifornia Wildfire Webcams: This link provides access to monitoring cameras in the area of the wildfire that are connected into the ALERTCalifornia network.
Additional County Information Links are towards the bottom with the social media feeds
Evacuation & Shelter Information
LA County Evacuation Information & Map: This information is part of LA County’s Emergency Incident Response Page.
Genasys Protect (Zonehaven Aware) Evacuation Map: This map does not include anything in Ventura County as they do not use Genasys Protect.
American Red Cross – Open Shelters: This link connects to the Red Cross’s page listing all their active shelters in the US.
Demographics
Average Number of Persons per Household: Los Angeles County – 2.89 people, Ventura County – 3.00 people; State average – 2.89 people
Los Angeles County Percent of Persons: 5.0 % Under 5 Years; 20.4% Under 18 Years; 15.2% Over 65 Years.
Ventura County Percent of Persons: 5.2% Under 5 Years; 21.6% Under 18 Years; 17.5% Over 65 Years.
Owner-occupied housing unit rate: Los Angeles County is 46.2%; Ventura County is 64.1%; State average is 55.6%
Data from US Census Bureau‘s 2023 Population Estimates Program.
Note – unless otherwise noted, these are county demographics and more local conditions may differ some.
Infrastructure Links
Jump to Section: Resource Links Air Quality Weather Fuel Conditions County Links & Social Media Feeds
These links are not specific to the wildfire, but are for the various infrastructures in general.
Power & Gas
Poweroutage.us County Outage Lists – Los Angeles County, Ventura County: This site provides aggregates live power outage data, though may not include some of the smaller local utilities.
Local Utility Outage Maps:
Communications
Verizon California Outage Map and List: This map/list reflects outages that may result in a disruption to coverage in a zip code.
AT&T Outage Map: This map includes wireless, digital phone, landline, internet, and DSL outages. You will need to select the desired service from the dropdown.
Cisco’s ThousandEyes Internet Outage Map: The map is an at-a-glance visualization of global Internet health over the last 24 hours, showing the frequency of Internet outages and service outages as seen across ISP, public cloud and edge service networks, as well as about 75 business SaaS and consumer application providers. The map is updated every 5 minutes. A list of the included business SaaS and consumer application providers can be found on the FAQ page.
Xfinity Outage Search: Xfinity internet outage map requires entry of an address to search for an outage.
NWS Transmitter/Receiver Outage Map: This maps shows National Weather Service transmitters and receivers that are experiencing an outage or degraded performance.
Fuel
GasBuddy Gasoline Availability Tracker: The GasBuddy Tracker shows gas stations that have fuel, limited options, and no fuel using different color markers.
Roads
Caltrans Quick Map: This Caltrans map provides real-time traffic information including traffic speed, lane and road closures due to construction and maintenance activities, incident reports, Changeable Message Sign (CMS) content, camera snapshots, and active chain control requirements. The different categories of information can be controlled with check boxes in the Caltrans QuickMap drop down menu.
Caltrans Check Current Highway Conditions: This page allows a user to enter a highway/state route number and receive information on current conditions.
Caltrans District 7 covers Los Angeles and Ventura counties
Caltrans Truck Network Map for District 7
Caltrans CA Road System – Functional Classification
LA County Road Closures Map and List: This website only shows the closure of roads that are maintained by Los Angeles County Public Works in unincorporated County areas.
Ventura County Road Closures Map: This map shows road closures and advisories affecting county maintained roads.
Caltrans Webcams – If Caltrans Webcam shows “Temporarily Unavailable” – This condition is caused by a problem communicating with the remote camera site to retrieve the picture (JPEG) image.
Aviation
FAA No Fly Zones: This page provides a list of no fly / restricted flight areas.
Flight Radar 24: Provides real-time aviation information. It can be used to see flight paths of aviation fire fighting resources including both planes and helicopters.
Mail & Freight Shipping
USPS has several pages providing service alerts and post office closures.
USPS Service Alerts USPS National Map USPS California News USPS Industry Alerts and Notices
Courier Delivery Services Alert & Service Disruption Pages
Air Quality & Smoke Links
South Coast Air Quality Management District Advisories: The South Coast AQMD covers large areas of Los Angeles, Orange, Riverside and San Bernardino counties.
Ventura County Air Pollution Control District: The Ventura County Air Pollution Control District will continue to monitor the air quality conditions due to smoke from the Post Fire.
Smoke Plume Map: This map provides current particle pollution air quality information, fire locations and smoke plumes, smoke forecast outlooks (where available), and recommendations for actions to take to protect yourself from smoke.
Smoke Forecast Outlooks: Smoke outlooks are issued in collections where smoke from wildland fires may be of concern and Air Resource Advisors have been deployed. This page lists all current outlooks issued over the past two days.
AirNow Map: This map from the EPA displays the highest NowCast Air Quality Index among the three included pollutants (ozone, PM2.5, and PM10).
AirNow EnviroFlash: EnviroFlash is a system that allows you to sign up for e-mails about your daily air quality forecast.
Weather
Wind Map
Temperature Map
National Weather Service Watches, Warnings, and Advisories
Warning – A warning is issued when a hazardous weather or hydrologic event is occurring, is imminent, or has a very high probability of occurring. A warning is used for conditions posing a threat to life or property.
Advisory – Highlights special weather conditions that are less serious than a warning. They are for events that may cause significant inconvenience, and if caution is not exercised, it could lead to situations that may threaten life and/or property.
Watch – A watch is used when the risk of a hazardous weather or hydrologic event has increased significantly, but its occurrence, location, and/or timing is still uncertain. It is intended to provide enough lead time so that those who need to set their plans in motion can do so.
These definitions are from the National Weather Service Glossary.
Regional Fuel Conditions
Burning Index
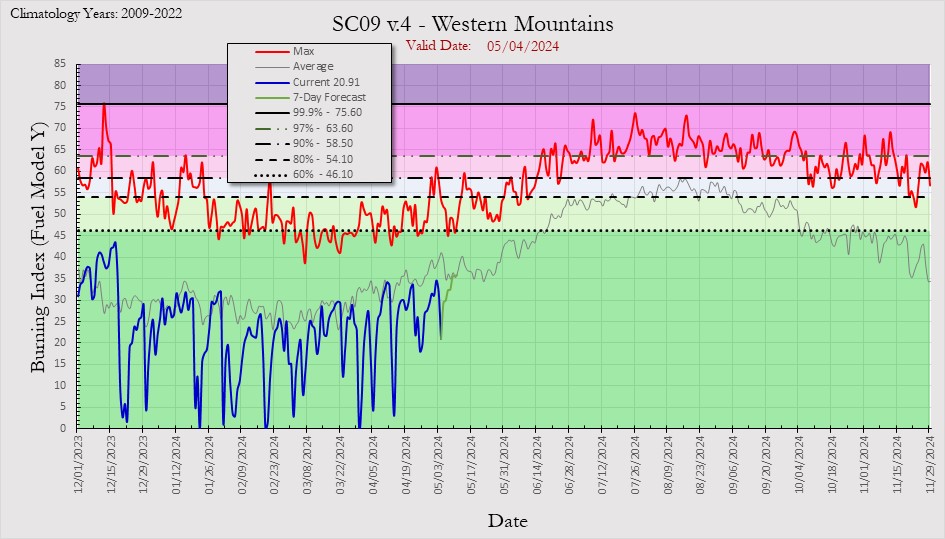
Burning Index is a measure of fire intensity. It combines the Spread Component (a rating of the forward rate of spread of a head fire) and Energy Release Component (estimated potential available energy released per unit area in the flaming zone of a fire) to relate to the contribution of fire behavior to the effort of containing a fire.
100-Hour Fuel Moisture
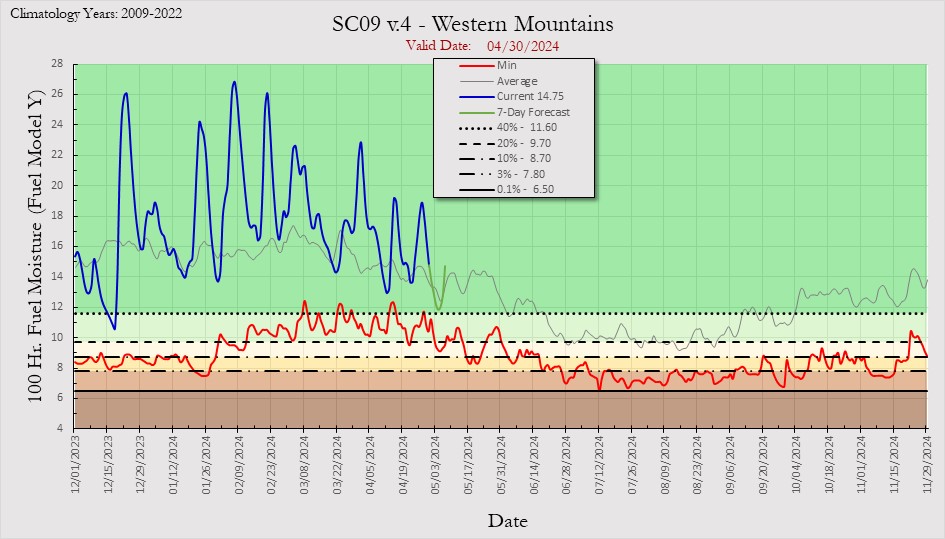
100-Hour Fuel Moisture is computed from 24–hour average conditions composed of day length, hours of rain, and daily temperature/humidity ranges. It can also be used as a very rough estimate of the average moisture content of the forest floor from three-fourths inch to four inches below the surface.
County Links & Social Media Feeds
Jump to Section: Resource Links Infrastructure Links Air Quality Weather Fuel Conditions
Los Angeles County Links
Los Angeles County Emergency Page: This page includes information on evacuations, shelter locations, health alerts, road closures, and media releases.
LA County Fire Public Information Officer: This is the official X (Twitter) feed of the Los Angeles County Fire Department Public Information Office (PIO), providing emergency incident driven information.
211 LA County: A hub for community members and community organizations looking for all types of health, human, and social services in Los Angeles County.
LA County Road Closures Map and List: This website only shows the closure of roads that are maintained by Los Angeles County Public Works in unincorporated County areas.
Alert LA County: LA County uses CodeRed for its emergency notifications. Yes this link to sign up to sign up to receive alerts. LA County’s Emergency Notifications website provides more details about Alert LA County and has links to the other emergency notification systems used by cities within the county.
Ventura County Links
Ventura County Emergency Page: This page provides information on current incidents. Navigation to additional information such as evacuations is accessible via the top menu.
211 Ventura County: During times of disaster, 211VC coordinates with local and national emergency services to provide incident-specific information, including road closures, food and medical assistance, and shelter.
Ventura County Consolidated Nixle Feed: This feed combines all of the local Nixle feeds from various city and county agencies within Ventura County.
Ventura County Road Closures Map: This map shows road closures and advisories affecting county maintained roads.
VC Alert: Ventura County uses Everbridge as their mass notification systems. This link shows recent notifications sent via the system. To register to receive alerts, select sign up from the top menu options.