Ventura County Winter Storm/Flooding
Page/Links Last Updated: January 26, 2024
Resource Links
Jump to Section: Weather, River Status & Hazard Maps Infrastructure Social Media Feeds
County Links
Ventura County Emergency Website: This site includes response and recovery information.
Ventura County Real-time Incident Dashboard
County Resource Management Agency Environmental Health Press Releases
VC Alert: County Emergency Alert Notification Sign-up
Emergency Proclamations
Philanthropic Support
Ventura County Community Foundation Storm Fund
Philanthropy California’s 2024 California Disaster Response: Philanthropy California is an alliance of Northern California Grantmakers, Southern California Grantmakers, and Catalyst of San Diego and Imperial Counties. They partner with the Governor’s Office of Emergency Services (Cal OES) to support immediate disaster relief and long-term recovery efforts. Philanthropy California monitors wildfires & natural hazard events and provides individual and institutional funders with vetted funds, resources, and events on this response page.
Weather, River Stage/Flow, & Hazard Maps
Jump to Section: Resource Links Infrastructure Social Media Feeds
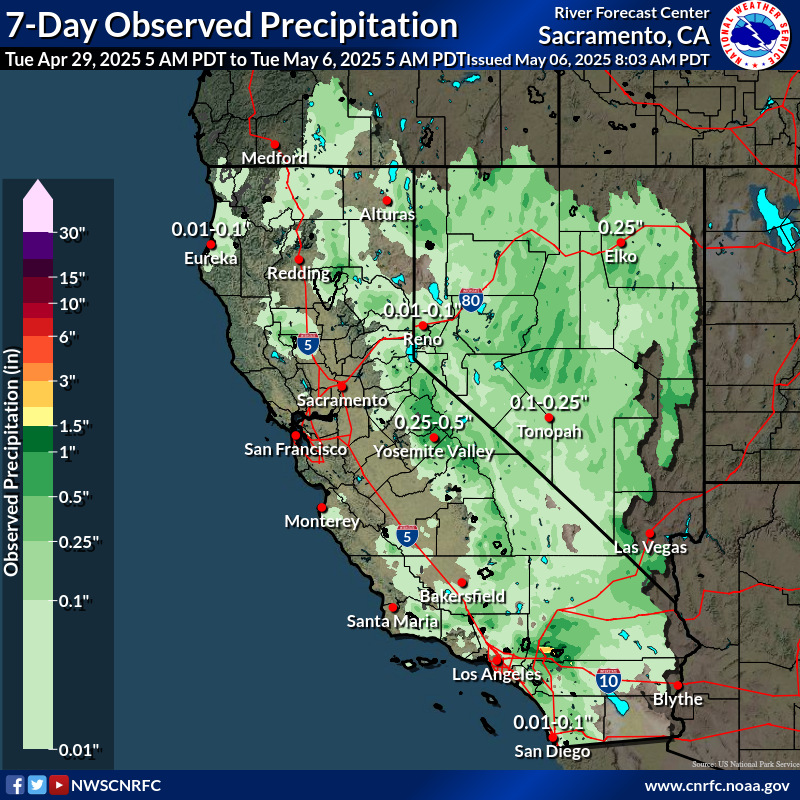
Observed Precipitation Past 7 Days
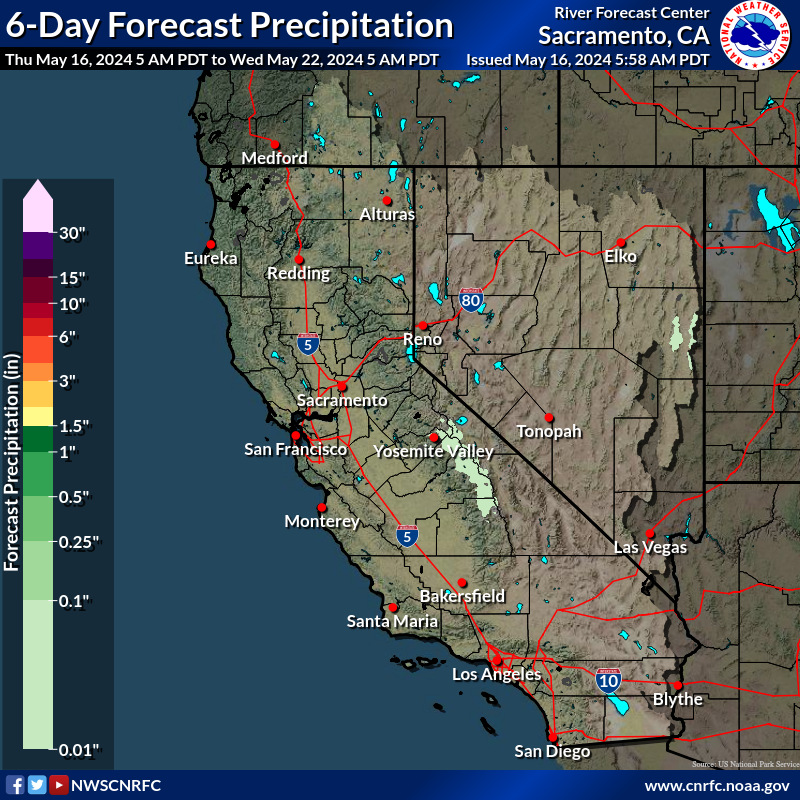
6-Day Forecast Precipitation
National Weather Service Watches, Warnings, and Advisories
Warning – A warning is issued when a hazardous weather or hydrologic event is occurring, is imminent, or has a very high probability of occurring. A warning is used for conditions posing a threat to life or property.
Advisory – Highlights special weather conditions that are less serious than a warning. They are for events that may cause significant inconvenience, and if caution is not exercised, it could lead to situations that may threaten life and/or property.
Watch – A watch is used when the risk of a hazardous weather or hydrologic event has increased significantly, but its occurrence, location, and/or timing is still uncertain. It is intended to provide enough lead time so that those who need to set their plans in motion can do so.
These definitions are from the National Weather Service Glossary.
 Current watches, warnings, and advisories for Ventura County (CAC111) CA
- An error has occurred, which probably means the feed is down. Try again later.
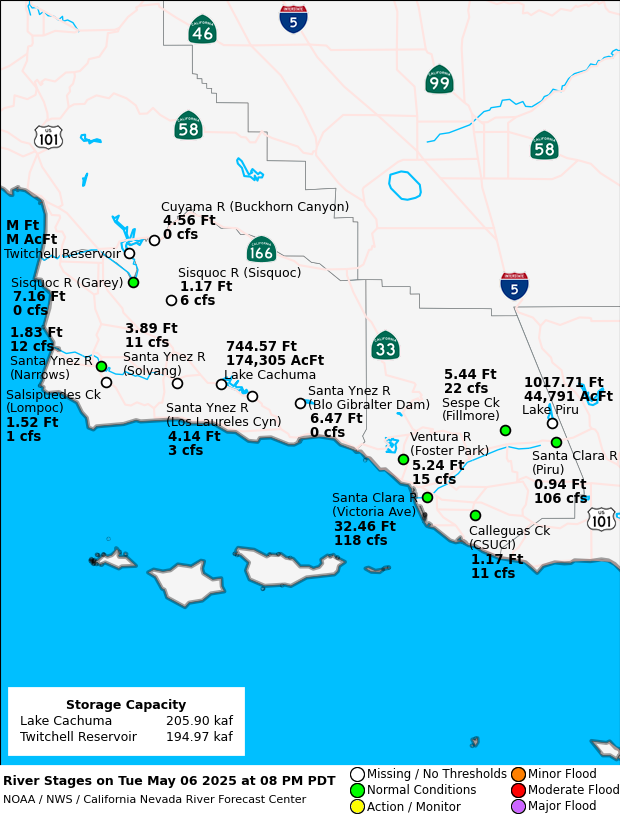
Observed River Stage/Flow Map
Hazard Maps
Note: These maps are general reference and not specific to the current storms.
California Department of Water Resources’ Best Available Maps (BAM) Website: The floodplains shown delineate areas with potential exposure to flooding for three different storm events: 100-year, 200-year, and 500-year. These flows and resulting flooded area are based on the best available floodplain information and may not identify all areas subject to flooding.
California Department of Water Reroutes’ Levee Flood Protection Zone (LFPZ) Maps: Levee Flood Protection Zone maps estimate the maximum area that may be flooded if a State-Federal levee fails with flows at maximum capacity that may reasonably be conveyed. These maps specifically focus on flood risks associated with State-Federal levees.
FEMA National Flood Hazard Layer: The National Flood Hazard Layer (NFHL) is a geospatial database that contains current effective flood hazard data. FEMA provides the flood hazard data to support the National Flood Insurance Program.
FEMA Flood Map Service Center: The FEMA Flood Map Service Center (MSC) is the official public source for flood hazard information produced in support of the National Flood Insurance Program. Use the MSC to find your official flood map, access a range of other flood hazard products, and take advantage of tools for better understanding flood risk.
Additional Links
Ventura County Department of Public Works Rainfall Map: Using the Time Intervals dropdown you can select different time intervals from the season to the 15 minutes.
Ventura County Public Works County Stream Flow Map
Ventura County Public Works Stream Webcams
California Nevada River Forecast Center Map
USGS Water Alert: Get notifications for changes in water conditions based on thresholds you choose.
USGS National Water Dashboard: This viewer shows provisional real-time water data collected at USGS observation stations in context with weather-related data from other public sources.
NOAA Weather Prediction Center Excessive Rainfall Forecast: In the Excessive Rainfall Outlook, the Weather Prediction Center forecasts the probability that rainfall will exceed flash flood guidance within 40 kilometers (25 miles) of a point.
Soil Moisture Map: This high-resolution gridded soil moisture map shows soil moisture percentiles at 20 cm depth. Data are updated daily with a 1-day delay due to differences in network report timing.
Infrastructure Links
Jump to Section: Resource Links River Status & Hazard Maps Weather Social Media Feeds
Power
Poweroutage.us Ventura County Outage List – This site provides aggregates live power outage data, though may not include some of the smaller local utilities.
Roads
Ventura County Public Works Road Closures Map
Caltrans Check Current Highway Conditions
Caltrans District 7 Updates – covers the counties of Los Angeles and Ventura
Caltrans Truck Network Map for District 7
Caltrans CA Road System – Functional Classification
CHP Traffic Incident Information Page (select San Luis Obispo region from the Communications Office dropdown menu)
Communications
Cisco’s ThousandEyes Internet Outage Map – covers about 75 business-critical SaaS applications
Mail & Freight Shipping
US Postal Service (USPS): Service Alerts; National Map; California News; Industry Alerts and Notices


